The Stats view displays all of the stat groups that are included in the report for each view.
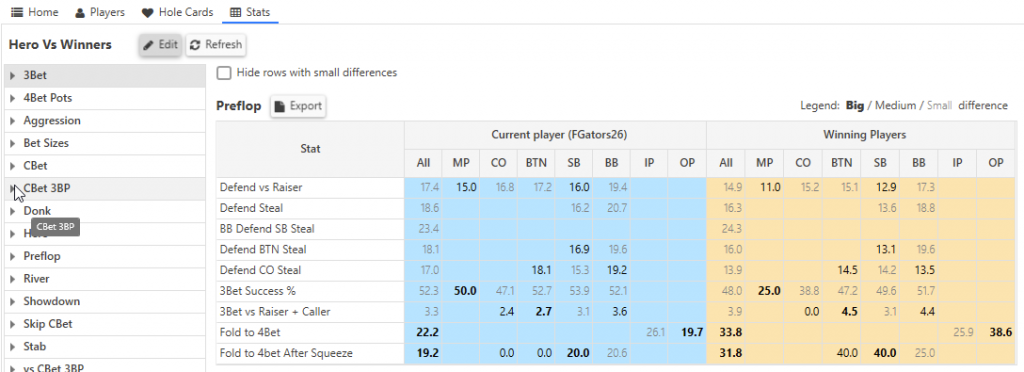
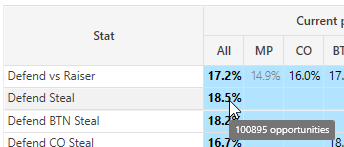
On the left side of the view is a list of all stat groups included in the report. On the right side are the stat values for the selected stat group.
Stat values are grouped by position when possible. Blank values means that stat value is not available.
Values that have large differences between the two views are highlighted in bold.
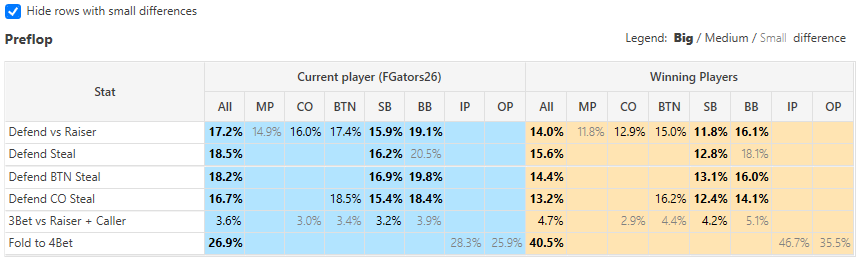
Hide Small Differences
Check the Hide Small Differences check box to hide rows that only contain small differences
Tool Tip Descriptions
Hovering your cursor over a stat header will show a tool tip with a description of the stat.
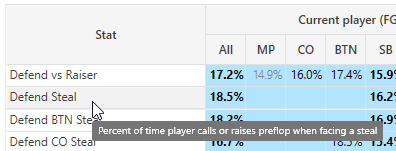
Hovering over a stat value will show the number of hands where that stat had the opportunity to occur.
Stat Details
Clicking on an arrow icon in the left view will expand the stat group to show the stats included in the group.
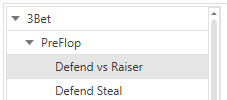
Selecting an individual stat will show more details about the stat.
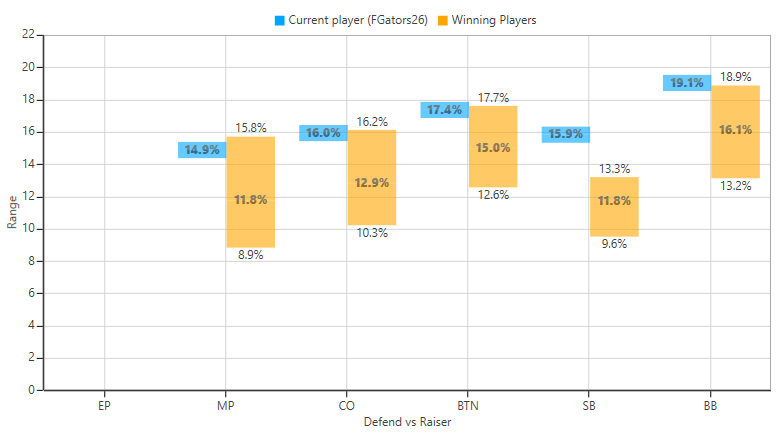
The stat details show a value range for each position.
The stat position details display three values when the view includes more than one player.
- Average – The average value of all players in the view
- Max – The average of all players whose value is greater than the average value
- Min – The average of all players whose value is less than the average value
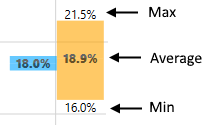
The average value is the value displayed in the stats grid. The min and max values provide an indication of how much the stat values vary between the players.
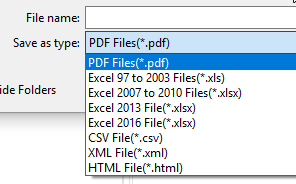
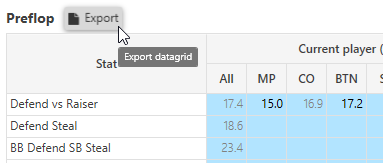
Export Datagrid
You can export the datagrid data by clicking the Export button next to the view title.
The export window allows you to export the data in several format byt choosing the file type.